You can do your essential business plan numbers yourself. It doesn’t take a CPA or MBA. Just do a simple forecast for your business. It doesn’t take an advanced degree, or an econometric model; it takes common sense and knowing your business.
I’ve been at the front lines of this, as a well-paid vice president in a high-tech market research firm. Our clients paid us big sums to predict market growth, inflation, and trends. I ran some very sophisticated forecasting projects that ended up proving nothing much beyond the fact that the people working in those markets, doing business there every day, know more than the data manipulations. All data-based forecasting is based on using the past to predict the future.
“It is far better to foresee even without certainty than not to foresee at all.” — Henri Poincare
And in the meantime, hard as may be to forecast sales and expenses, it’s harder still to run a business without forecasting them. You need to break things down into meaningful chunks, make some educated guesses, and then follow up with regular plan vs. actual review and revisions.
This chapter has three parts, all about your essential business plan numbers:
Forecast Your Sales: includes cases and examples. The math is simple. But you have to be comfortable with making educated guesses. Examples for email marketing, web marketing, a deli, etc.
Budget Your Expenses: you really need to be able to estimate future expenses. It’s part of normal management and business ownership.
Plan for cash: Be so careful with this: profits are not cash. You can be profitable without having cash in the bank. Several hidden factors matter.
“Hard as it may be to forecast sales and expenses, it’s harder still to run a business without forecasting them.” — Tim Berry
Yes, you can forecast your sales. Don’t think you need to have an MBA degree or be a CPA. Don’t think it’s about sophisticated financial models or spreadsheets. I was a vice president of a market research firm for several years, doing expensive forecasts, and I saw many times that there’s nothing better than the educated guess of somebody who knows the business well. All those sophisticated techniques depend on data from the past. And the past, by itself, isn’t the best predictor of the future. You are. So let’s look at how to forecast sales, step by step.
Your sales forecast won’t accurately predict the future. We know that from the start. What you want is to understand the sales drivers and interdependencies, to connect the dots, so that as you review plan vs. actual results every month, you can easily make course corrections.
If you think sales forecasting is hard, try running a business without a forecast. That’s much harder.
Your sales forecast is also the backbone of your business plan. People measure a business and its growth by sales, and your sales forecast sets the standard for expenses, profits and growth. The sales forecast is almost always going to be the first set of numbers you’ll track for plan vs. actual use, even if you do no other numbers.
If nothing else, just forecast your sales, track plan vs. actual results, and make corrections; that’s already business planning.
Match Your Forecast to Your Accounting
It should be obvious: Make sure the way you organize the sales forecast in rows or items or groups matches the way your accounting (or bookkeeping) tracks them.
Match your chart of accounts, which is what accountants call your list of items that show up in your financial statements.
If the accounting divides sales into meals, drinks, and other, then the business plan should divide sales into meals, drinks, and other. So if your chart of accounts divides sales by product or service groups, keep those groups intact in your sales forecast. If bookkeeping tracks sales by product, don’t forecast your sales by channel instead.
If you’re planning for a startup business, coordinate the bookkeeping categories with the forecasting categories.
Get your last Income Statement (also called Profit & Loss) and keep it in view while you develop your future projections.
If you don’t have more than 20 or so each rows of sales, costs, and expenses, then make the rows in the projected statement match the rows in the accounting.
If your accounting summarizes categories for you – most systems do – consider using the summary categories in your business plan. Accounting needs detail, while planning needs a summary.
If your categories in the projections don’t match the accounting output, you’re not going to be able to track plan vs. actual well. It will take retyping and recalculating. And you’ll lose the most valuable business benefit of business planning: management, steering your company.
The math is simple
Normally your sales forecast will group sales into a few manageable rows of sales and show projected units, prices, and sales monthly for the next 12 months and annually for the second and third years in the future. Here’s a quick example from the bicycle retailer named Garrett I’ve used in other examples (with columns for April-November hidden on purpose, to make viewing easier):
The math for a sales forecast is simple.
Multiply units times prices to calculate sales. For example, unit sales of 36 new bicycles in March multiplied by $500 average revenue per bicycle means an estimated $18,000 of sales for new bicycles for that month.
Total Unit Sales is the sum of the projected units for each of the five categories of sales.
Total Sales is the sum of the projected sales for each of the five categories of sales.
Calculate Year 1 totals from the 12 month columns. Units and sales are sums of the 12 columns, and price is the average, calculated by dividing sales by units.
The numbers for Year 2 and Year 3 are just single columns; unless you have a special case, projecting monthly results for two and three years hence is overkill. It’s a problem of diminishing returns; you don’t get enough value to justify the time it takes. Other experts will disagree, by the way; and there may be special cases in which extended monthly projections are worth the effort.
Estimate Direct Costs
A normal sales forecast includes units, price per unit, sales, direct cost per unit, and direct costs. Direct costs are also called COGS, cost of goods sold, and unit costs.
Most people learn COGS in Accounting 101. That stands for Cost of Goods Sold, and applies to businesses that sell goods. COGS for a manufacturer include raw materials and labor costs to manufacture or assemble finished goods. A bookstore’s COGS include what the store owner pays to buy books. COGS for a bicycle store owner are what he paid for the bicycles, accessories, and clothing he sold during the month. Direct costs are the same thing for a service business, the direct cost of delivering the service. So, for example, it’s the gasoline and maintenance costs of a taxi ride.
Direct costs are specific to the business. The direct costs of a bookstore are its COGS, what it pays to buy books from a distributor. The distributor’s direct costs are COGS, what it paid to get the books from the publishers. The direct costs of the book publisher include the cost of printing, binding, shipping, and author royalties. The direct costs of the author are very small, probably just printer paper and photocopying; unless the author is paying an editor, in which case what the editor was paid is part of the author’s direct costs.
The costs of manufacturing and assembly labor are always supposed to be included in COGS. And some professional service businesses will include the salaries of their professionals as direct costs. In that case, the accounting firm, law office, or consulting company records the salaries of some of their associates as direct costs.
The illustration below shows how Garrett uses estimated margins to project the direct costs for his bicycle store. For the highlighted estimates, the direct entry for bicycles unit cost is the product of multiplying the price by 68 percent. The total direct costs for bicycles in January are the result of multiplying 30 units by $340 per unit.
estimating direct costs
Some Quick Notes About Standards
Timing Matters
Standard accounting and financial analysis have rules about sales and direct costs and timing. A sale is when the ownership of the goods changes hands, or the service is performed. That seems simple enough but what happens sometimes is people confuse promises with sales. In the bike store example, if a customer tells Garrett in May that he is definitely going to buy 5 bicycles in July, that transaction should not be part of sales for May. Garrett should put those 5 bicycles into his July forecast and then they will actually be recorded as sales in the bookkeeping actual sales in July when the transaction takes place. In a service business, when a client promises in November to start a monthly service in January, that is not a November sale.
Direct costs also happen when the goods change hands. Technically, according to accounting standards (called accrual accounting), when Garrett the bike storeowner buys a bicycle he wants to sell, the money he spent on it remains in inventory until he sells it. It goes from inventory to direct costs for the income statement in the month in which it was sold. If it is never sold, it never affects profit or loss, and remains an asset until some day when the accountants write off old never-sold obsolete inventory, at which time its lowered value becomes an expense. In that case it was never a direct cost.
What’s Accrual Accounting and Why You Care
Business accounting is either cash basis or accrual. I hate how attractive “cash basis” sounds, because accrual is way better, and easier to manage too. Cash basis accounting only works right if you absolutely always pay immediately for every business purchase, and you never buy something before you sell it, and all of your customers pay you in full whenever they buy something from you. So accrual is better.
Here’s why, in a few obvious examples.
You make a sale when you deliver the goods. If the customer doesn’t pay you immediately, in cash basis nothing is recorded. The sale doesn’t even show up in your books until the customer pays. In accrual, you record the accrued amount as Accounts Receivable, so you keep track of the amount, the date, and the customer who owes it to you. It’s obvious that unless you never sell without immediate payment, accrual basis is better.
You order some goods. When you receive them, you don’t pay for them. You owe the money. You have an invoice to pay. In cash basis, nothing happens until you pay up. In accrual basis, you record the accrued amount as Accounts Payable, along with the date, a record of what you bought, and who and when you are supposed to pay. So cash basis is better only if you pay everything immediately; all normal businesses need accrual.
I hate the fact that the accounting standards set a few generations ago chose to call it “cash basis” when you don’t record money owed into your books until it’s paid; or money you owe until you pay it. It’s a terrible idea to keep that information in your head instead of in your bookkeeping. That causes many mistakes as we business owners fail to keep track and remind ourselves of these outstanding obligations. And yet, ironically, they call that “cash basis” accounting. I do wish that the right way to do it, which is accrual accounting, didn’t have such an off-putting name.
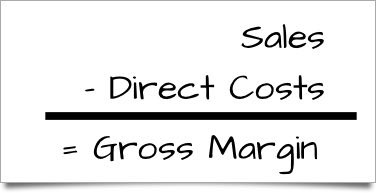
Gross Margin
Once you have sales forecast and direct costs, you can calculate your estimated gross margin. Gross Margin is sales less direct costs. Gross Margin is a useful basis of comparison between different industries and between companies within the same industry. You can find guidelines and rules of thumb for different industries that give you an industry profile or average gross margin for different industries. For example, industry profiles will tell you that the average gross margin for retail sporting goods is 43%. Every business is different, but knowing the standards and averages gives you some useful comparisons.
The distinction isn’t always obvious. For example, manufacturing and assembly labor are supposed to be included in direct costs, but factory workers are paid sometimes when there is no job to work on. And some professional firms put lawyers’ accountants’ or consultants’ salaries into direct costs. These are judgment calls. When I was a young associate in a brand-name management consulting firm, I had to assign all of my 40 hour work week to specific consulting jobs for cost accounting.
Garrett can easily calculate the gross margin he’s projecting with his sales forecast. The illustration below shows his simple calculation of gross margin using his sales and direct costs.
But how do you know what numbers to put into your sales forecast? The math may be simple, yes, but this is predicting the future; and humans don’t do that well. Don’t try to guess the future accurately for months in advance. Instead, aim for making clear assumptions and understanding what drives sales, such as web traffic and conversions, in one example, or the direct sales pipeline and leads, in another. And you review results every month, and revise your forecast. Your educated guesses become more accurate over time.
Use experience and past results
Experience in the field is a huge advantage. In the example above, Garrett the bike storeowner has ample experience with past sales. He doesn’t know accounting or technical forecasting, but he knows his bicycle store and the bicycle business. He’s aware of changes in the market, and his own store’s promotions, and other factors that business owners know. He’s comfortable making educated guesses. In another example that follows, the café startup entrepreneur makes guesses based on her experience as an employee.
Use past results as a guide. Use results from the recent past if your business has them. Start a forecast by putting last year’s numbers into next year’s forecast, and then focus on what might be different this year from next. Do you have new opportunities that will make sales grow? New marketing activities, promotions? Then increase the forecast. New competition, and new problems? Nobody wants to forecast decreasing sales, but if that’s likely, you need to deal with it by cutting costs or changing your focus.
Start with your best guess, and follow up. Update your forecast each month. Compare the actual results to the forecast. You will get better at forecasting. Your business will teach you.
How to Forecast a New Business or New Product
What? You say you can’t forecast because your business or product is new? Join the club. Lots of people start new businesses, or new groups or divisions or products or territories within existing businesses, and can’t turn to existing data to forecast the future.
Think of the weather experts doing a 10-day forecast. Of course they don’t know the future, but they have some relevant information and they have some experience in the field. They look at weather drivers such as high and low pressure areas, wind directions, cloud formations, storms gathering elsewhere. They consider past experience, so they know how these same factors have generally behaved in the past. And they make educated guesses. When they project a high of 85 and low of 55 tomorrow, those are educated guesses.
You do the same thing with your new business or new product forecast that the experts do with the weather. You can get what data is available on factors that drive your sales, equivalent to air pressure and wind speeds and cloud formations. For example:
To forecast sales for a new restaurant (there is a detailed example coming in the next section), first draw a map of tables and chairs and then estimate how many meals per mealtime at capacity, and in the beginning. It’s not a random number; it’s a matter of how many people come in. So a restaurant that seats 36 people at a time might assume it can sell a maximum of 50 lunches when it is absolutely jammed, with some people eating early and some late for their lunch hours. And maybe that’s just 20 lunches per day the first month, then 25 the second month, and so on. Apply some reasonable assumption to a month, and you have some idea.
To forecast sales for a new mobile app, you might get data from the Apple and Android mobile app stores about average downloads for different apps. And a good web search might reveal some anecdotal evidence, blog posts and news stories perhaps, about the ramp-up of existing apps that were successful. Get those numbers and think about how your case might be different. And maybe you drive downloads with a website, so you can predict traffic on your website from past experience and then assume a percentage of web visitors who will download the app (The following sections on Sample Sales Forecast for a Website and Sample Sales Forecast for Email Marketing offer more examples).
So you take the information related to what I’m calling sales drivers, and apply common sense to it, human judgment, and then make your educated guesses. As more information becomes available — like the first month’s sales, for example – you add that into the mix, and revise or not, depending on how well it matches your expectations. It’s not a one-time forecast that you have to live with as the months go by. It’s all part of the lean planning process.
Sales forecast depends on product/service and marketing
Never think of your sales forecast in a vacuum. It flows from the strategic action plans with their assumptions, milestones and metrics. Your marketing milestones affect your sales. Your business offering milestones affect your sales. When you change milestones — and you will, because all business plans change — you should change your sales forecast to match.
In this sample sales forecast for a restaurant, Magda is developing a lean plan for a café she wants to open in an office park. She wants a small locale, just six tables of four. She wants to serve coffee and lunches. She hasn’t contracted the locale yet, but she has a good idea of where she wants to locate it and what size she wants, so she wants to estimate realistic sales. She assumes a certain size and location and develops a base forecast to get started.
Establishing a base case
She starts with understanding her capacity. She does some simple math. She estimates that with six tables of four people each, she can do only about 24 sit-down lunches in an average day, because lunch is just a single hour. And then she adds to-go lunches, which she estimates will be about double the table lunches, so 48 per day. She estimates lunch beverages as .9 beverages for every lunch at the tables, and only .5 beverages for every to-go lunch. Then she calculates the coffee capacity as a maximum of one customer every two minutes, or 30 customers per hour; and she estimates how she expects the flow during the morning hours, with a maximum 30 coffees during the 8-9 a.m. hour. She also estimates some coffees at lunch, based on 3 coffees for every 10 lunches. You can see the results here, as a quick worksheet for calculations.
Where do those estimates come from? How does Magda know? Ideally, she knows because she has experience. She’s familiar with the café business as a former worker, owner, or close connection. Or perhaps she has a partner, spouse, friend, or even a consultant who can make educated guesses. And it helps to break the estimates down into smaller pieces, as you can see Magda has done here.
And, by the way, there is a lesson there about estimating and educated guesses: Magda calculates 97 coffees per day. That’s really 100. Always round your educated guesses. Exact numbers give a false sense of certainty.
Café monthly assumptions
She then estimates monthly capacity. You saw in Illustration 7-2 that she estimates 22 workdays per month, and multiplies coffees, lunches, and beverages, to generate the estimated unit numbers for a baseline sample month.
So that means the base case is about 1,500 lunches, about 1,000 beverages, and about 2,000 coffees in a month. Before she takes the next step, Magda adds up some numbers to see whether she should just abandon her idea. At $10 per lunch and $2 per coffee or beverage, that’s roughly $15,000 in lunches, $2,000 in lunch beverages, and $4,000 in coffees in a month. She probably calls that $20,000 as a rough estimate of a true full capacity. She could figure on a few thousand in rent, a few thousand in salaries, and then decide that she should continue planning, from the quick view, like it could be a viable business (And that, by the way, in a single paragraph, is a break-even analysis).
From base case to sample sales forecast
With those rough numbers established as capacity, and some logic for what drives sales, and how the new business might gear up, Magda then does a quick calculation of how she might realistically expect sales to go, compared to capacity, during her first year.
Month-by-month estimates for the first year
Sample Month-by-month Sales Forecast
All of which brings us to a realistic sales forecast for Magda’s café in the office park (with some monthly columns removed for visibility’s sake).
Notice that Magda is being realistic. Although her capacity looks like about $20,000 of sales per month, she knows it will take a while to build the customer base and get the business up to that level. She starts out at only about half of what she calculated as full sales; and she gets closer to full sales towards the end of the first year, when her projected sales are more than $19,000.
Important: these are all just rough numbers, for general calculations. There is nothing exact about these estimates. Don’t be fooled by how exact they appear.
Notice how she’s working with educated guessing. She isn’t turning to some magic information source to find out what her sales will be. She doesn’t assume there is some magic “right answer.” She isn’t using quadratic equations and she doesn’t need an advanced degree in calculus. She does need to have some sense of what to realistically expect. Ideally she’s worked in a restaurant or knows somebody who has, so she has some reasonable information to draw on.
Sample restaurant forecast direct costs
We’ve seen direct costs already, in the previous section. They are also called COGS, or cost of goods sold, or unit costs. In Magda’s case, her direct costs or COGS are what she pays for the coffee beans, beverages, bread, meat, potatoes, and other ingredients in the food she serves.
Just as with the sales categories, forecast your direct costs in categories that match your chart of accounts.
So, with her unit sales estimates already there, Magda needs only add estimated direct costs per unit to finish the forecast. The math is as simple as it was for the sales, multiplying her estimated units times her perunit direct cost. Then it adds the rows and the columns appropriately.
The idea with forecasting something new is start with something that’s easy to guess, then go on from there. That’s what Magda does in the previous section, going from restaurant layout with chairs and tables, to times of day, and days per week. This next sample sales forecast for email marketing projects unit sales from email results. Here again, the key is to track the assumptions. So here’s a sample sales forecast for the projected unit sales of the first few months of a product to be marketed via email.
email marketing sales assumptions
It starts of course with how many emails get sent. The assumption here is that the marketing department sends out 20,000 emails the first month, 25,000 the next month, and so forth. And let’s remember that while it’s easy to type numbers into a spreadsheet, execution requires an effective email message, design and formatting, and a good list of email addresses of real prospects. Targeting is essential.
Follow through with email assumptions
We put assumptions for how many people open the emails into the second row. And the assumption shown for January, by the way, is amazingly high, and quite unrealistic. A business would have to be sending emails to a list of opted-in email addresses for customers or prospects who like this sender a lot. Available information on average emails opened, from MailChimp and other vendors of email services, runs more like 15% to 25%. The numbers here are high.
We use the third row for our assumption for how many people click the link on the email. There too, this example is very optimistic. Normal rates rarely get above 2%.
Next is website views. With emails sent, emails opened as a percentage, and clicks as a percentage, we can project how many people click an email link and arrive at a website. In January, for example, we take 20000*.35*.08 = 560. Here again, the math is simple. The business behind it — a good email list, a good email, subject line, text, and links, and offering — is not simple.
Then we project a conversion rate, which is how many people who see the offer on the web choose to buy. The 0.5% (one half of one percent) assumption here is not unusually low. Actual conversion rates depend on how well targeted the people are who arrive at the website, how attractive the offer is, and many other marketing and sales variables.
Finally, in the last row, we arrive at projected sales. The indication here is that sending 20,000 emails produces the small unit sales shown here in the bottom row.
Finish the forecast
From here we would take the unit sales resulting from these assumptions to the main sales forecast, with the structure we use for the sample sales forecast above: units, prices, sales, direct costs per unit, and direct costs. The spreadsheets would look a lot like the ones for Magda, in the previous section; and Garrett the bicycle retailer in How to Forecast Sales.
This sample website sample sales forecast shows assumptions for a web business. Here too, we look at the key assumptions that lead to the unit sales forecast. The point is we don’t pull a forecast out of thin air, we base it on some sales drivers that we can predict, and, to some extent control — or at least track and revise. We can look at these in detail below.
Sample sales forecast assumptions for a website
First, estimate the drivers for web traffic
Clearly the web business sales assumptions depend on web traffic. In the first two rows of the forecast, we project reasonable numbers of web visits based on past web experience, search engine optimization (SEO), links that we can predict. In this case we break them into two categories:
First, website visits from organic search, based on the site, its contents, the SEO, and so forth. This projection may be optimistic because getting 200 people per month at the outset isn’t as easy as writing numbers into a spreadsheet. It takes marketing. Still, it’s an assumption we can track.
Second, website visits from social media. This assumes active engagement, posts, links, and updates on Facebook, Twitter, and other social media sites.
More about the pay-per-click assumptions
As you can see in the bottom two rows of the forecast, pay per click web traffic depends on two factors: how much you spend on pay-perclick advertising, and how much you pay for each click. A click in this case means somebody who was browsing on some other website, or who did a web search for some specific search word or phrase, clicked a link that went to your website. If you are not familiar with this kind of online marketing, there’s a good summary in Wikipedia under “pay per click”.
I base my assumptions here on bid-based pay-per-click systems, such as what Google uses. As you set up the campaign, you use a system where you bid for how much you’ll pay for each click you get from the paid area of search results when a web search requests a specific keyword. For example, the illustration here shows what happened when I searched for the term “restaurant in Eugene OR.” Two businesses have paid for the ad placement at the top. One is a restaurant supply business, the other a yellow-pages index. If I clicked on either one, I would go to that website and the business would be charged the pay per click amount. The rest of the search results are Google’s favorites, based on Google search algorithms, as the most useful.
Google search showing pay -per-click ads.
Conversion Rate and Projected Sales
The row labeled “Website conversion rate” holds the very important assumption for the percentage of website visitors who choose to buy the product. That assumption is half a percent (0.5%) for the first month, increasing to six tenths of a percent (0.6%) in the second month. The total unit sales estimate in “Total unit sales” comes from multiplying the conversion rate in “Website conversion rate” by the estimated web traffic in the row labeled “Total website visits.” So, for example, the projected 13 units for January is one half of one percent of the estimated 2,550 web visits.
Along with the revenue forecast, you need to plan and manage spending. Revenue is money coming in, and spending is money going out. This is how to budget expenses for your business plan.
By the way, the word budget, as I use it here, is exactly the same as forecast. The difference between the two is just custom. I could just as easily refer to revenue and spending budgets, or revenue and spending forecasts, as revenue forecast and spending budget. Most people are used to them the way I’m using them, with forecast for revenue and budget for spending.
There are three common types of spending in a normal business. These are the things you write checks for.
The first is costs, direct costs, what you spend on what you sell. Those are the costs you have already estimated in your sales forecast.
The second is your expenses. They are mostly operating expenses, like rent, utilities, advertising, and payroll.
The third is what you spend to repay debts and purchase assets. I call that “other spending.” These are important financial terms that you have to use correctly; so if you have any doubt, investigate what assets are and how debt repayment is different from interest expense, not an expense, but something that absorbs cash and affects the cash available to the business.
Let’s look first at the most common kind of spending, the operating expenses.
The Expense Budget
Make sure you understand expenses as a technical financial term. Expenses are spending like payroll and rent that aren’t part of direct costs and reduce profits and taxable income. You need to understand that difference if you are going to run a business and manage cash flow. If you have any doubts, please read up on that.
Just as you did for sales forecast and direct costs, try to always project expenses in the same categories you have in your chart of accounts. If your accounting divides marketing expenses into personnel, advertising, and PR, don’t project marketing expenses in your business plan as print, online, and social media. This is important.
Summary of Operating Expenses
Forecasting your operating expenses is a matter of experience, educated guessing, a bit of research, and common sense. Let’s look at a sample expense budget from the same bicycle business plan I used in the sales forecast section above (with middle columns cut out):
All the numbers are educated guesses. Garrett, the bicycle storeowner, knows the business. As he develops his first lean plan, he has a good idea of what he pays for rent, marketing expenses, leased equipment, and so on. And if you don’t know these numbers, for your business, find out. If you don’t know rents, talk to a broker, see some locations, and estimate what you’ll end up paying. Do the same for utilities, insurance, and leased equipment: Make a good list, call people, and take a good educated guess.
Payroll and Payroll Taxes are Operating Expenses
Payroll, or wages and salaries, or compensation, are worth a list of their own. In the case of the bike shop owner, for payroll, he does a separate list so he can keep track. Payroll is a serious fixed cost and an obligation. Garrett’s summary budget (above) has the one line for payroll but it comes from a separate list. He just takes the total into the budget. Here’s the list:
Notice that the totals from the Personnel Plan show up in the expense budget. And if you look closely (it may take a calculator) at the expense row “Payroll Taxes” and compare that amount to the total payroll, you’ll see that it’s an estimate based on 25 percent of payroll. Garrett uses “Payroll Taxes” as a blanket term; it includes what he spends on health insurance and other benefits.
Restaurant Example
Since I’ve used Magda’s new restaurant as an example for the sales forecast, I’m including its operating expenses here too, as a second example.
Simple Operating Expense Budget
The illustration shows Magda’s lean plan budget for expenses:
And we can also look at Magda’s budget for payroll. As with the bicycle store, the operating expenses include the summary of payroll from two rows: Gross Salary is in the row called “Payroll,” and Benefits are in the row above titled “Payroll Taxes”. Both of these come from the payroll projection in the following illustration:
While Garrett has some other expenses along with payroll taxes in his “Benefits,” Magda’s bare-bones startup has just the payroll taxes. That’s why Garrett’s estimate of benefits compared to gross salary is 25%, and Magda’s is only 15%. And that’s why Magda labels her operating expense row as “Payroll Taxes,” while Garrett calls his “Benefits.”
Other spending
This is tricky: standard accounting and financial analysis include only sales, costs, and expenses in the calculation of Profit and Loss. However, in the real world, some of what you spend isn’t included in either costs or expenses. For example, repaying a loan takes money, but doesn’t show up anywhere in the profit and loss. And if you have a product-based business and proper accrual accounting, the money you spend buying inventory doesn’t show up in the profit and loss until that inventory sells. Buying a vehicle or production equipment isn’t tax deductible and isn’t an expense; but it costs money. The rule of thumb is that all expenses are tax deductible, but not all spending is an expense.
What to do? Plan and track your operating expenses for sure. And if you need to handle loan repayments, purchasing assets, distributing profits, owners’ draw, or other spending outside of profit and loss, keep those in your spending budget. Keep track of them. Plan for them.
Understand Starting Costs
Startup costs are a special case that applies to startup businesses only. They are the sum of the assets you need to purchase before you start, plus the expenses you incur before you start. My advice on how to estimate starting costs is waiting for you later, in Appendix A.
Let me show you the difference between profits and cash with a simple example. Take the estimates we have in the previous sections for the sales, direct costs, and operating expenses of Garrett’s bicycle shop. Put them together and you have the illustration here below as projected operating income (remember that income and profit are the same thing):
Now we compare that to a simple cash flow projection based on the assumption that the store makes 90% of its sales on account (to be paid later) and its customers wait two months to pay those invoices. (That would be unusual for a bicycle store, yes, but it’s the common case for most existing business-to-business companies.) Also, let’s assume Garrett keeps about a month’s worth of sales as products in the store, called inventory, that customers can buy; and he has to buy those products in advance of selling them. The result is cash flow vastly different from profits, as you can see in the following illustration:
Conclusion: Profits are not cash
The difference between profits and cash, in this case, is more than $90,000 for a business selling about $30,000 monthly. That business would be profitable but bankrupt for lack of cash. And the change in the two scenarios is just cash flow, not a penny of sales, cost of sales, or expenses. No prices are changed, no new employees added, and no changes made in salary.
Here’s how that difference looks graphically:
So you see it in this example: beware the cash flow traps. Profits are not cash in the bank.
Assess your cash flow risk with this simple method here. Your business might not have the factors that make cash flow so different from profits. Maybe managing sales and expenses is enough for your business. It depends on the specific factors here.
Item
Details
1.
Product Inventory
Give yourself 1 point if you deal with product inventory you have to buy and pay for before you can sell it. Add another point for each month of average inventory
2.
Sales on Credit
1 point if you have to wait for customers to pay invoices (instead of collecting all in cash, check, or credit card when you make the sale of deliver the service.) Add an additional point for every month beyond one that you wait, on average, for customers to pay.
3.
Deposits in advance
If you added a point for #2 above, subtract 1/2 point for having customers pay significant (35% or more) deposits up front.
4.
Other Spending
Add another point if you have to pay significant principle payments on debts, or purchase significant assets (equipment, vehicles, etc.)
5.
Accounts payable
Subtract 1/2 point if you pay expenses by collecting invoices from vendors and waiting a month or more before paying.
What the cash flow risk assessment means
If you scored less than one with this cash flow risk assessment, heave a sigh of relief and watch your sales, cost of sales, and expenses very carefully. You don’t have to calculate cash flow as a separate exercise. Develop and manage projections of sales, cost of sales, operating expenses, and other spending including repayment of debt and purchase of assets. Put your sales, costs, expenses, and other spending into a worksheet showing your projections for the next 12 months. And maybe, just to be sure, you continue reading with the next section on cash traps, and the one after that, showing a cash example.
If you assess your cash flow risk as 1 or more on this cash flow risk assement, you might still read the next two sections just to be sure, but face it, you can’t afford not to manage cash flow carefully. Aside from just lean business planning, you need to fully understand and manage cash flow; or have somebody on your team who does. You need the three linked projections covered in Section 5: Profit and Loss, Balance Sheet, and, especially, Projected Cash Flow.
True cash-only businesses are extremely rare. Such a business would have to sell entirely in cash, check, or credit card; not ever have to buy inventory or anything else before it makes a sale, and would immediately pay for everything it buys. Maybe that’s a crafts-market artisan? A writer? I’m not sure; but that’s why I put the cash flow risk assessment ahead of this section. For the rest of us, you have to understand these essential principles of cash flow. When in doubt, plan for the worst.
Profits aren’t cash.
Profits aren’t cash; they’re accounting. And accounting is a lot more creative than you think. You can’t pay bills with profits. Actually, profits can lull you to sleep. If you pay your bills and your customers don’t, it’s suddenly business hell. You can make profits without making any money. Profits are an accounting concept; cash is what we spend. We pay the bills and payroll with cash. While a lean business plan doesn’t necessarily include a full-blown financial forecast (at least not until the business plan event, when it will be needed), of course it should include planning for cash.
This should be a pretty simple concept, but it becomes difficult because we’re trained to think about profits more than cash. It’s the general way of the world. When people do the mythical business plan on a napkin, they think about what it costs to build something, and how much more they can sell it for, which means profits.
Essential principle of cash flow: Profits are not cash
However, you can be profitable without having any money in the bank. And what’s worse is that it tends to happen a lot when you’re growing, which turns good news into bad news and catches people unprepared.
Cash Flow Isn’t Intuitive.
Don’t try to do it in your head unless you have that extremely simple business. Making the sale doesn’t necessarily mean you have the money for it. Incurring the expense doesn’t necessarily mean you paid for it already. Inventory is usually bought and paid for and then stored until it becomes cost of sales. Being profitable doesn’t guarantee you have money in the bank. Most of us have to take the extra step to plan cash, not just profits.
Essential principle of cash flow: it is not intuitive
It’s paradoxical. The best of times can be hiding the worst of times. One of the toughest years my company had was when we doubled sales and almost went broke. We were building things two months in advance and getting the money from sales six months later. Add growth to that and it can be like a Trojan horse, hiding a problem inside a solution. Yes, of course you want to grow, but be careful because growth costs cash. It’s a matter of working capital. The faster you grow, the more financing you need.
Every Dollar of Receivables is A Dollar Less Cash.
Although it’s not intuitive, it’s true that more receivables mean less cash. You can do the analysis pretty quickly. Assets have to equal capital minus liabilities, so if you have a dollar of receivables as an asset, that pretty much means you have one dollar less in cash. If your customers had paid you, it would be money, not accounts receivable.
This comes up all the time in business-to-business sales. In most of the world, when a business delivers goods or services to another business, instead of getting the money for the sale right away, there is an invoice and the business customer pays later. That’s not always true, but it is the rule, not the exception. We call that “sales on credit,” by the way, and it has nothing to do with sales paid for by credit card (which, ironically, is usually the same as cash less a couple of days and a couple of percentage points as fees). Some people call it “sales on account.”
We can use this essential principle of cash flow in making financial projections: the more assets you have in receivables, the less in cash.
Example: A company running smoothly with an average of a 45-day wait for its receivables has a steady cash flow with a minimum balance of just a little less than $500,000. The same company is more than half a million dollars in deficit when the number of its average collection days goes to 90 instead of 45. That’s a swing of more than a million dollars between the two assumptions. And that’s in a company with less than $10 million annual sales, and fewer than 50 employees. And the company in the sample case that preceded this section, with sales of about $30,000 a month, has a gap between operating profits and cash flow of more than $90,000. You can click here to jump back to those numbers and a chart to go with it.
And the trick is that profit and loss doesn’t care about receivables. You have as much profit when you sell $1,000 that your customers haven’t paid yet as when you sell $1,000 that your customers paid instantly in cash. Obviously, the cash flow implications are different in either case.
Learn to live with it: every additional dollar in receivables is one dollar less in cash flow.
Every Dollar Spent on Inventory is a Dollar Less Cash.
When your business has to buy stuff before it can sell it, that’s called inventory. It’s one of your assets. And keeping a lot of inventory can do bad things to your cash flow, unless you don’t pay for it.
This can be pretty simple math. If having nothing in inventory leaves you with $20,000 in cash, then having $19,000 in inventory leaves you with only $1,000 in cash. That is, if you’ve paid for the inventory. That’s because your other assets, your liabilities, and your capital are all the same.
Sometimes, of course, you cannot pay for that inventory, which means you have more payables, and your cash balance is supported by those payables. That’s my next point…
Every Dollar of Payables is a Dollar More of Cash.
While receivables and inventory suck up money by dedicating assets to things that might have been cash but aren’t, paying your own bills late is a standard way to protect your cash flow. The same basic math applies, so if you leave your money in cash instead of using it to pay your bills, you have more cash.
It’s called “accounts payable,” meaning money that you owe. Every dollar in accounts payable is a dollar you have in cash that won’t be there if you pay that bill. The same problem you have when you sell to businesses is an advantage you have when you are a business. The seller’s accounts receivable is the buyer’s accounts payable.
Now I don’t want to imply that you don’t pay your bills, or that it doesn’t matter. Your business will have credit problems and a bad reputation if it doesn’t pay bills on time, or if it is chronically late with payments. Still, a lot of businesses use accounts payable to help finance themselves.
Working Capital is a Survival Skill.
Technically, working capital is an accounting term for what’s left over when you subtract current liabilities from current assets. Practically, it’s money in the bank that you use to pay your running costs and expenses and buy inventory while waiting to get paid by your business customers.
Quote me on this one: working capital is a survival skill.
Plan ahead. You get no extra points for spontaneity when dealing with banks. If you see a growth spurt coming, a new product opportunity or a problem with customers paying, the sooner you get to the bank armed with charts and a realistic plan, the better off you’ll be.
Watch The Vital Metrics.
If you have sales on credit, Collection days measure how long you wait to get paid. If you manage physical products, Inventory turnover is a measure of how long your inventory sits on your working capital and clogs your cash flow. And for any business that takes advantage of the standard commercial credit, Payment days measure how long you wait to pay your vendors. Always monitor these three vital signs of cash flow. Estimate them 12 months ahead and compare your plan with what actually happens.
Managing Cash Flow
At this point you’ve done your sales forecast and spending budget. Unless your business is extremely simple, you should still plan for cash. You already did most of the projections.
To really project cash flow properly you need to understand the relationship between the three main accounting statements, which are beyond the scope of lean business planning. I do recommend that every business owner should plan cash flow using correct financial calculations that link the main financial statements to make a connected system in which every change affects the whole system, and the balance always balances. However, for the purpose of your lean plan, you may choose to manage cash flow by watching the flow of sales and expenses and key balances.
Hint: LivePlan does this almost automatically. You input assumptions for inventory, sales on credit, how long you wait, and LivePlan takes all of that into account as it projects your estimated cash month by month.